
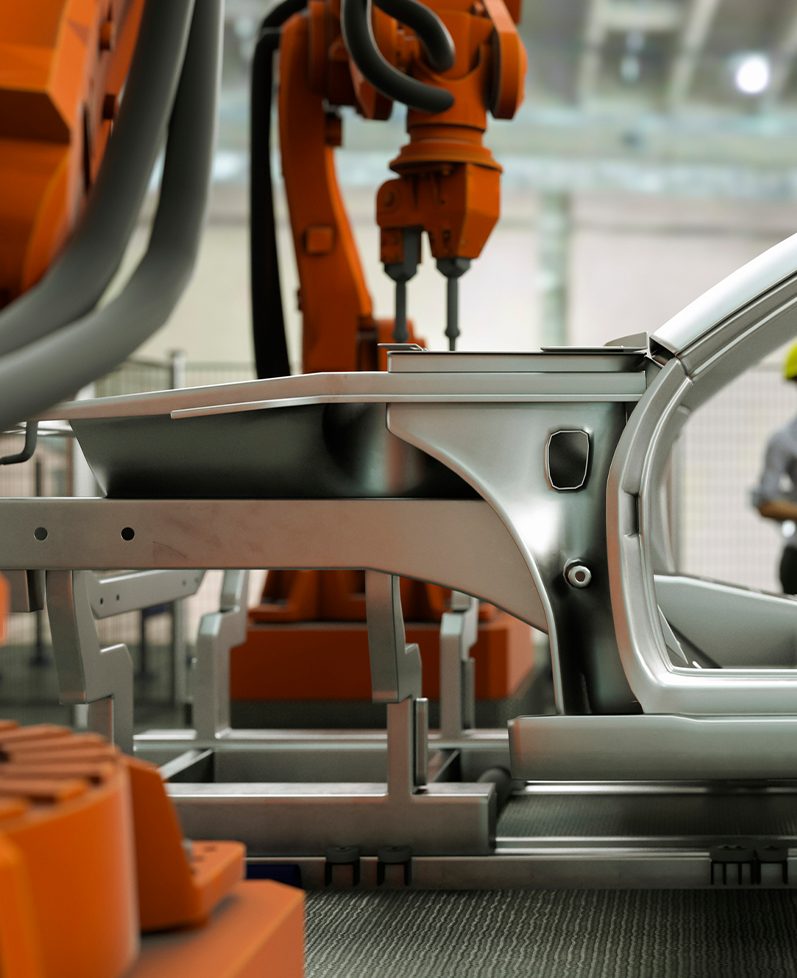
Where PV Lines Stall—and How Smart Steps Change the Math
Why do good lines still slip?
Small steps decide big output. In every PV module plant, the quiet waits between stations set the tone. Picture Monday at 7 a.m.—lights on, crews ready, screens all green. If your solar module production line shows 82% OEE and a tidy 96.5% yield, it feels safe. Yet the truck still leaves late. In Part 1, we mapped stations and takt-time math; now we pull back the cover on what actually drags flow. Direct truth: micro-stops at the stringer, slow changeovers on the lamination press, and rework loops after EL inspection cost more than a headline defect rate. They fragment time. And time is the only currency you can’t reorder.

Here’s the data you don’t always see in dashboards: five 40‑second stops per hour at the tabber-stringer equal a lost module, every hour. A 90‑second wait for EVA splicing pushes the laminator’s idle-to-heat cycle, which then adds thermal drift. AOI flags a busbar misalignment, and IV flash repeats twice “just to be sure.” Look, it’s simpler than you think—these are not giant failures; they’re tiny, common ones. But they stack into missed ship windows and overtime. So the question is simple: how do we cut the hidden time sink without flooding the floor with buffers or extra hands? Let’s shift from symptoms to sources and set up a cleaner baseline for action.
The Hidden Pain Points the Dashboards Miss
What keeps yield stuck?
Traditional fixes add cushions: larger WIP racks, more operators at glass layup, or a longer lamination recipe “for safety.” These look prudent, yet they mask constraints. MES averages hide the spikes; SPC charts smooth the edges. Meanwhile, edge cases keep biting—ribbon refeed on the stringer, vacuum picker mis-grips after a nozzle swap, EVA wrinkles that only show under EL imaging. The result: IV testing repeats, and “first-pass” isn’t first. Microcracks slip by during rush hours, then bounce back as rework. Your line moves, but value doesn’t—funny how that works, right?
Here’s the deeper layer. Pain points live at the handoffs, not the headliners. Solder wetting varies with cell coating lot; the AOI threshold catches more false positives after a lighting change; the junction box potting cure steals minutes if the ambient drifts by 3°C. These aren’t dramatic alarms; they’re slow leaks. Old-school responses—add buffer, slow the conveyor, extend lamination—treat symptoms but tax capacity. They also invite drift in process windows and make root cause harder to trace. Tighten the upstream signal instead: stabilize stringer thermal profiles, lock light-source calibration for EL, and keep IV flash bias stable with verified power converters. That’s where yield moves, and where stress leaves the floor.
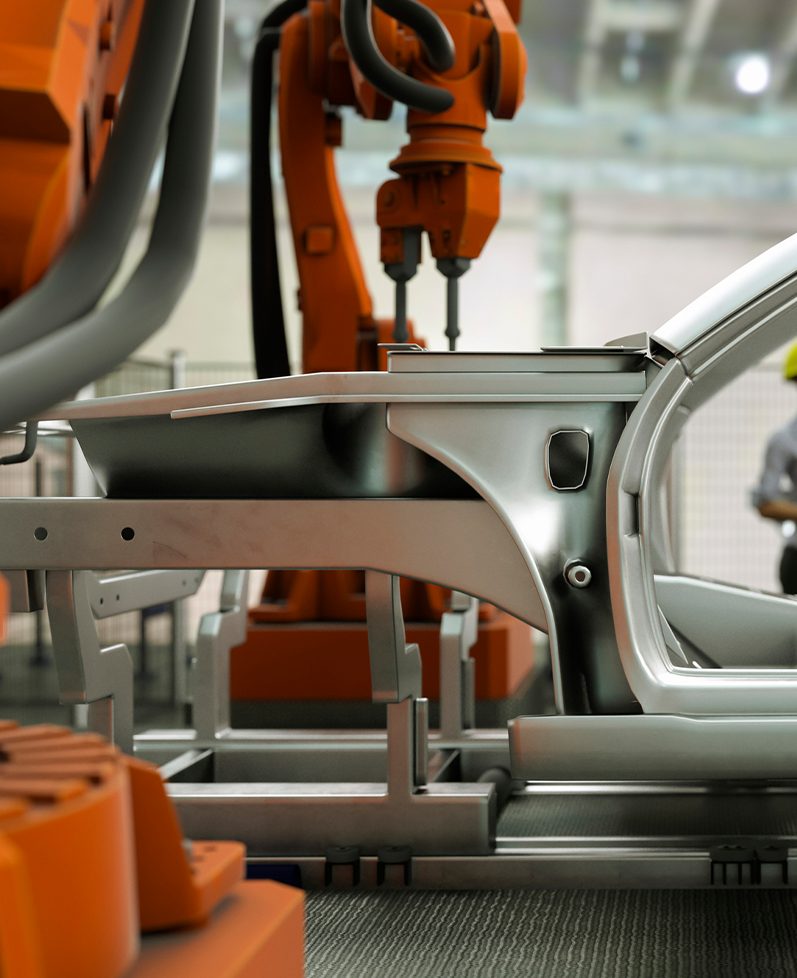
From Reactive Fixes to Predictive Flow
What’s Next
The forward step is principle-driven control. Think closed-loop flow, not isolated machines. Place edge computing nodes at the stringer and EL stations to score every string for solder wetting, ribbon tension, and microcrack risk. Feed that score forward to the layup and laminator so recipes adapt per panel—thermocouple mapping drives real-time ramp and dwell, not a one-size curve. AOI and EL signals combine to route a suspect panel to a shorter, protective laminate profile, then to a focused IV test. In practice, this is a lightweight digital twin: station models predict drift, SCADA events confirm it, and the line self-corrects. When solar module production behaves like this, you cut rework before it exists and stabilize bottleneck takt without adding bodies.
Keep it practical and measurable. Aim for adaptive control at the true choke points: tabber-stringer heat zones, layup alignment vision, and lamination pressure gradients. Then pick three evaluation metrics to guide choices. One: pre-lamination EL first-pass rate (no-retest percentage) as your earliest yield anchor. Two: micro-stop density at bottlenecks—events under 60 seconds per hour at the stringer and laminator—because small stops drive big loss. Three: normalized cost per watt with rework included, not excluded, so savings are real. Track those for six weeks, and you’ll see the line calm down. Better flow, cleaner data, fewer surprises—and a crew that trusts the system. For deeper methods and tools, keep learning with LEAD.